Table Of Contents
ToggleUS Weight Loss Statistics Reveal Changing Attitudes In 2024
According to the CDC’s National Center for Health Statistics, obesity affects 41.9% of adults in the United States. If we look at the percentage of adults who are overweight or obese, the number jumps to 73.6%. The good news is that judging by weight loss sentiments expressed online, some Americans are trying to do something about it.
Using data from March 12, 2023, to March 12, 2024, Polly assessed the responses of 7,337,454 people in the US, shedding light on weight loss stances and practices and demographics by age, gender, and region.
Find out what Americans are saying about losing weight and how attitudes are shifting across the States.
Weight Loss Stances and Practices In the US
Polly’s analysis of weight loss sentiments expressed online shows that people in the US are aware of various practices. Take a closer look at these stances and practices and find out how they rank in popularity.
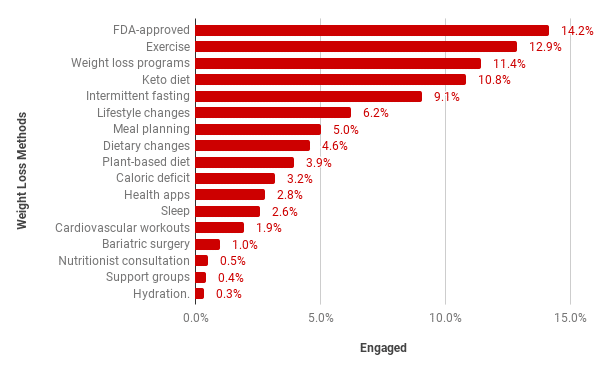
Polly’s data shows that Americans are talking about a plethora of weight loss methods, from medications and exercise to support groups and hydration. The most engagement (14.2%) took place around the topic of FDA-approved medications, followed by exercise (12.9%) and weight loss programs (11.4%). The least engagement took place around nutritionist consultation (0.5%), support groups (0.4%), and hydration (0.3%).
In between, going from most to least popular, we found practices including keto diet (10.8%), intermittent fasting (9.1%), lifestyle changes (6.2%), meal planning (5.0%), dietary changes (4.6%), plant-based diet (3.9%), calorific deficit (3.2%), health apps (2.8%), sleep (2.6%), cardiovascular workouts (1.9%), and bariatric surgery (1.0%).
Polly also revealed an interesting timeline in terms of when these weight loss stances were being expressed online. According to this data, some topics that saw a high level of engagement at one stage are no longer being spoken about, while others are only starting to enter into more people’s awareness.
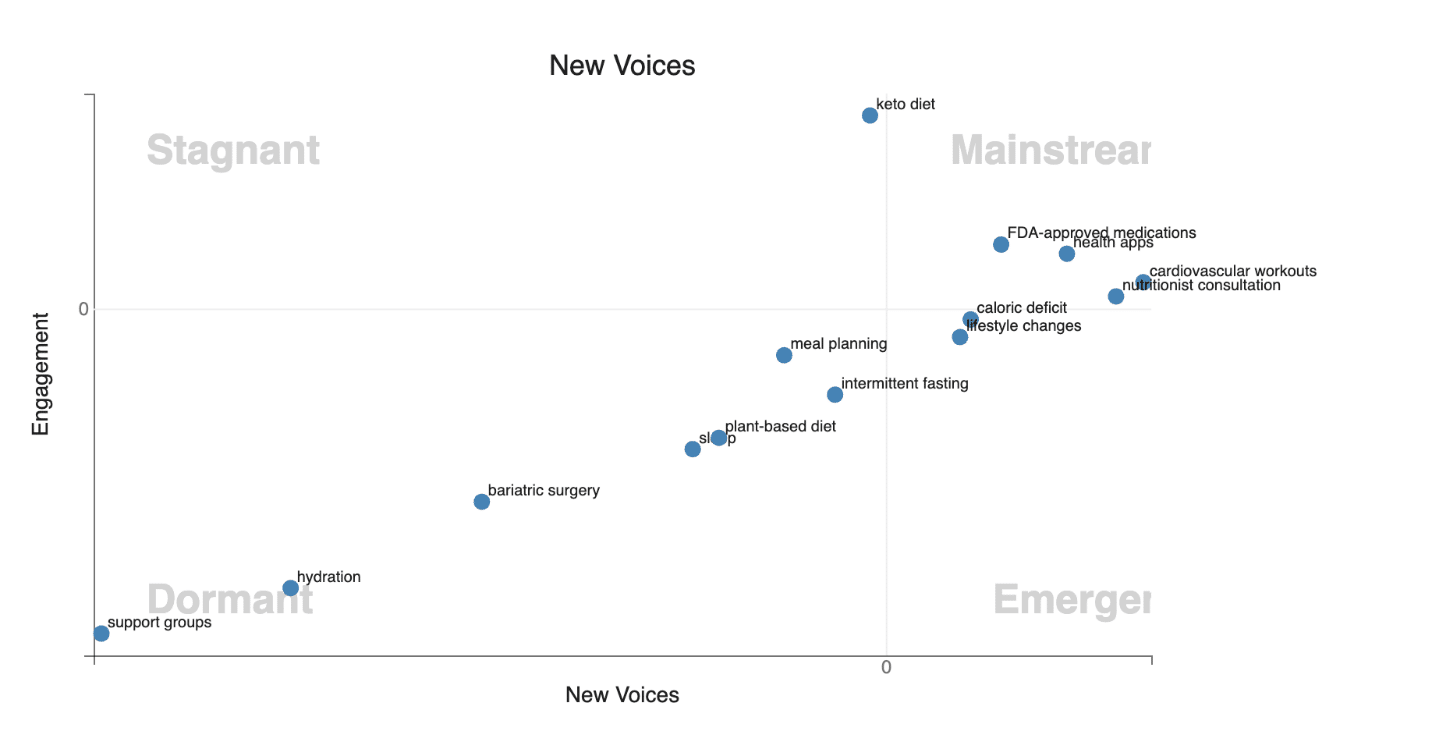
The above graph shows that support groups, hydration, bariatric surgery, sleep, plant-based diet, meal planning, and intermittent fasting have become dormant.
While the keto diet was certainly a popular weight loss topic in the past, this is no longer the case. Compared to the previous six months, fewer new voices discussed keto in the 6 months up to March 2024, so this topic experienced some stagnation. However, sentiments around lifestyle changes and calorific deficits are growing in popularity to the point of almost becoming mainstream.
According to Polly, FDA-approved medications, health apps, nutritionist consultations, and cardiovascular workouts have become more mainstream. This is shown by the high level of engagement, and the number of new voices expressed online about these treatments.
Polly’s data ties in with recent statistics on weight loss methods. According to Statista, 81% of American adults who said they wanted to lose weight indicated that they were interested in increasing the amount of exercise they do.
72% said they were interested in following a specific diet, while 43% said they were interested in weight loss programs such as Noom and Weight Watchers. 32% of Americans who said they wanted to lose weight indicated an interest in GLP-1 prescription drugs such as Ozempic and Wegovy, and 23% indicated that they were interested in weight loss surgery.
The National Center for Health Statistics reported that, among adults who tried to lose weight, 62.9% said they tried exercising, and the same percentage tried eating less food, making these the most commonly reported weight loss methods.
50.4% said they tried eating more fruits, vegetables, and salads, and 44.7% said they tried drinking a lot of water, while 42.4% said they tried eating less fast food or junk food. 88.3% of these adults reported that they used two or more of these weight loss methods.
Weight Loss Engagement by Age Group
Polly’s online analysis of weight loss sentiments found varying engagement levels by age group and that expected engagement levels were not quite in line with the actual engagement numbers. In the graph below, the red line is the expected engagement level, and the blue is the actual engagement level as per Polly’s data:
Ranked from highest to lowest by engagement, Polly’s data shows which age groups had the most to say about losing weight:
- >65 – 1,900,000
- 55-64 – 1,400,000
- 45-54 – 1,200,000
- 35-44 – 1,110,000
- <25 – 800,000
- 25-34 – 630,000
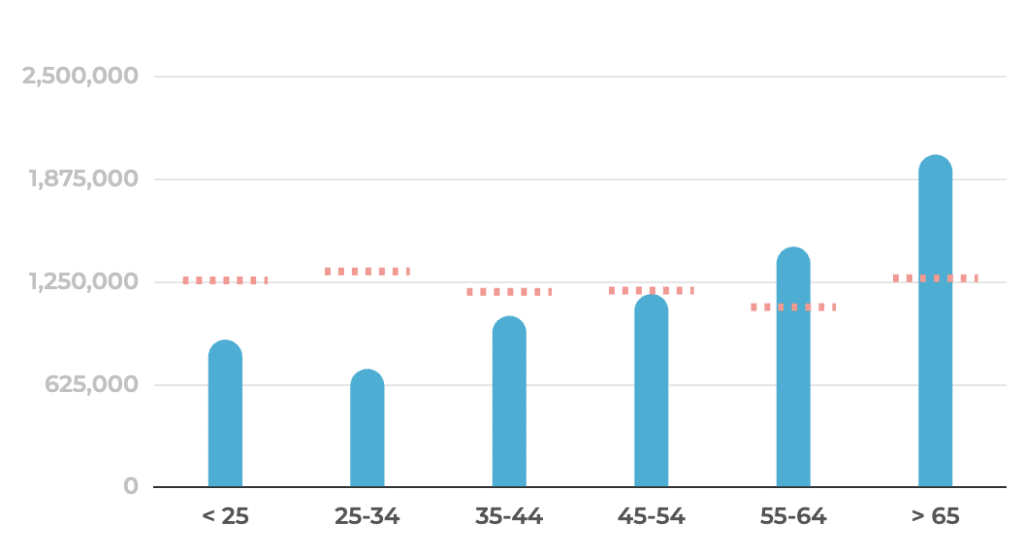
With approximately 1,900,000 individuals talking about weight loss, the >65 age group was by far the most vocal. Arguably, the most surprising aspect of this demographic was the difference between the expected level of engagement, indicated by the red line, and the actual level of engagement, indicated by the blue line. At slightly more than 1,250,000, the expected level of engagement was much lower than what Polly’s analysis found.
The 55-64 age group had the second-highest actual engagement level. As indicated by the blue line, the number of individuals who engaged on the topic was 1,400,000. Again, this was higher than the expected level of engagement, which was projected to be 1,200,000. The 45-54 age group had the third highest actual level of engagement (1,200,000) and almost matched the expected level of engagement for this demographic.
The 35-44 age group had an actual level of engagement of 1,110,000 people. This was somewhat below the 1,200,000 expected engagement level. Approximately 800,000 people under age 25 engaged on the topic of weight loss. This actual level of engagement was far lower than the 1,250,000 expected level of engagement. At 630,000 people, the 25-34 age group had the lowest actual level of engagement. This was significantly lower than the 1,260,000 expected engagement level.
However, Polly’s findings reflect sentiments expressed online, which explains why the situation on the ground may be slightly different.
According to the National Centre for Health Statistics, 52.4% of adults aged 40-59 tried to lose weight, compared to 49.7% of adults aged 20-39 and 42.7% of adults aged 60 and over. There was no significant difference between younger and middle-aged adults.
Neither Polly’s data nor the Health Statistics for people who tried to lose weight reflect the prevalence of obesity by age group in the US. According to the CDC, the prevalence of obesity was 41.5% among adults aged 60 and older, 44.3% among adults aged 40 to 59, and 39.8% among adults aged 20 to 39.
Weight Loss Engagement by Gender
The levels of engagement on weight loss also varied significantly by gender. Let’s take a closer look at
what Polly’s data revealed about these demographics.
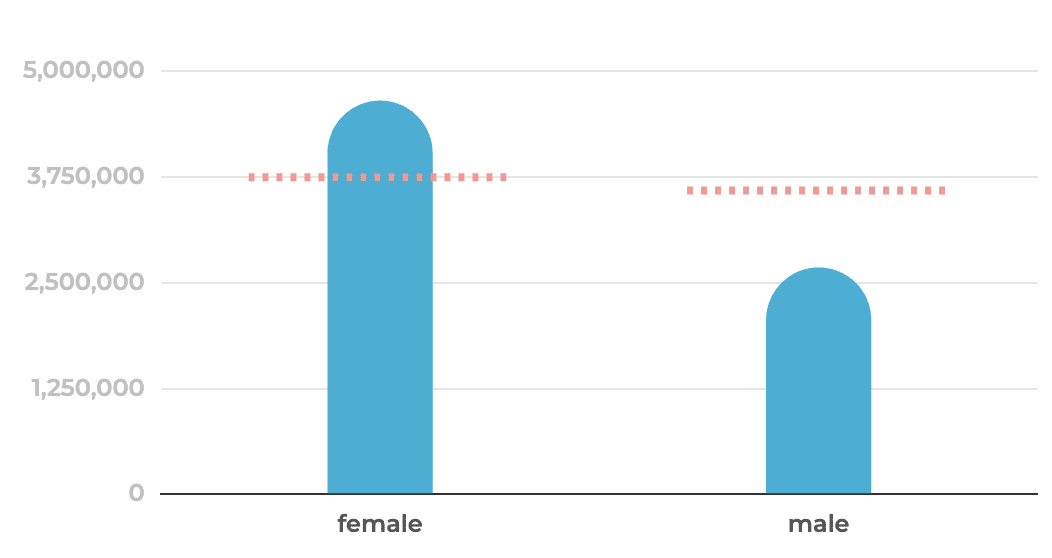
According to Polly, the actual level of engagement by females was much higher than that of males. Furthermore, females’ actual engagement level was higher than their expected engagement level, while males’ actual level of engagement was much lower than expected. Polly’s data shows:
- Female – 4,500,000
- Male – 2,550,000
The actual level of engagement of females was approximately 4,500,000, which was higher than the expected level of engagement of 3,750,000, indicated by the red line. The actual level of engagement of males was around 2,550,000. This was much lower than the expected level of engagement of 3,700,000.
Polly’s data is roughly in line with findings published on Statista. According to the statistics site, 55% of US women and 47% of men stated that they wanted to lose weight in 2023. These figures were both down from the respective 59% and 51% in 2020.
The CDC also found differences between women and men when it came to losing weight. According to the CDC, 56.4% of women said they tried to lose weight, compared to 41.7% of men.
Weight Loss Engagement by Region
When it comes to weight loss engagement by region, Polly’s data had a few
surprises in store. Let’s delve into these demographics.
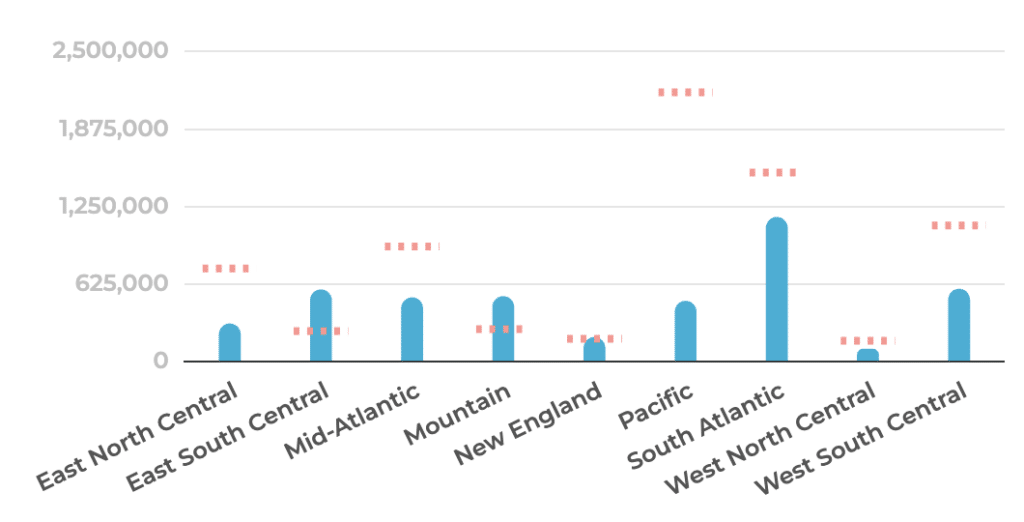
According to Polly, the South Atlantic region had the highest level of engagement on the topic, followed by East South Central, West South Central, Mid-Atlantic, Mountain, Pacific, East North Central, New England, and West North Central. Let’s put numbers to these:
- South Atlantic – 1,000,000
- East South Central – 600,000
- West South Central – 600,000
- Mid-Atlantic – 590,000
- Mountain – 590,000
- Pacific – 550,000
- East North Central – 300,000
- New England – 250,000
- West North Central – 1,500,000
The most surprising aspect of Polly’s data is that only the East South Central and Mountain regions’ actual levels of engagement surpassed their expected levels. East South Central had an approximate 600,000 actual engagement level, which was higher than the 300,000 expected engagement level, while Mountain’s approximate 590,000 actual engagement level was higher than the region’s 300,000 expected engagement level.
New England’s 250,000 actual engagement level was the same as its expected level of engagement. Of the regions whose actual engagement levels fell below their expected engagement levels, the one with the greatest disparity was the Pacific region. The actual engagement level for the Pacific region was approximately 550,000, which was significantly lower than the expected engagement level of 2,000,000.
Polly’s data makes for interesting reading when compared to findings on obesity prevalence in the US region published by the National Center for Biotechnology Information (NCBI) and the National Library of Medicine. According to the NCBI, obesity prevalence was 35.3% in East South Central, 33.9% in West South Central, 31.8% in East North Central, 29.9% in South Atlantic, 27.4% in Middle Atlantic, 26.2% in Mountain, 25.9% in Pacific, and 25.4% in New England.
Narrowing our focus to a few specific states, we found that, according to America’s Health Rankings, 62.8% of people in California are overweight, while only 28.1% of the population is obese. 64.0% of New York’s population is overweight, while 30.1% is obese, and 70.2% of Texas’ population is overweight, while 35.5% is obese.
Older Women Driving the Weight Loss Conversation
Polly’s data indicates that, at least when it comes to the sentiments Americans express online, the conversation around losing weight revolves mostly around FDA-approved medications, exercise, and weight loss programs, followed by dietary options and various lifestyle changes.
What’s more, middle-aged (55-64) and older (65+) women in the South Atlantic, East South Central, and West South Central regions are driving the conversation. Looking at Polly’s data as well as the other data we gathered, it’s clear that, with current overweight and obesity rates, more needs to be done to raise awareness among Americans.
About The Data
Data sourced from Polly, who created an independent sample of 7,337,454 people from Twitter, Reddit and TikTok in the USA over the past 12 months from March 12, 2023 – March 12, 2024. Responses were collected and analyzed to produce outcomes within a 90% confidence interval and 5% margin of error. Engagement estimated how many people in the location are participating. Demographics were determined using many features, including name, location, and self-disclosed description. Privacy was preserved using k-anonymity and differential privacy. Results are based on what people describe online — questions were not posed to the people in the sample.
Share:


